
- Home
- Forums
- Groups
- Maps
- Resources
- We Have / We Need
- Cholera
- Water Filtration - Homemade ORS
- CTC - Development and Operation
- Cholera - Clinical Presentation and Management
- Cholera Kit - Medical Supplies Guidelines
- Haiti Cholera Training Materials
- Origins of Epidemic
- Posters - Clinical Presentation and Management
- Video - The Story of Cholera - Andeyo Version
- Video - The Story of Cholera - English
- Video - The Story of Cholera - Haitian Creole
- Archive
User login
Language
Anonymous's groups in this site
User is not a member of any group.
Your groups across all your sites
User is not a member of any group.
Recent Content
Who's online
There are currently 0 users online.
You are here
Mon, 2024-03-18 10:47 — mike kraft
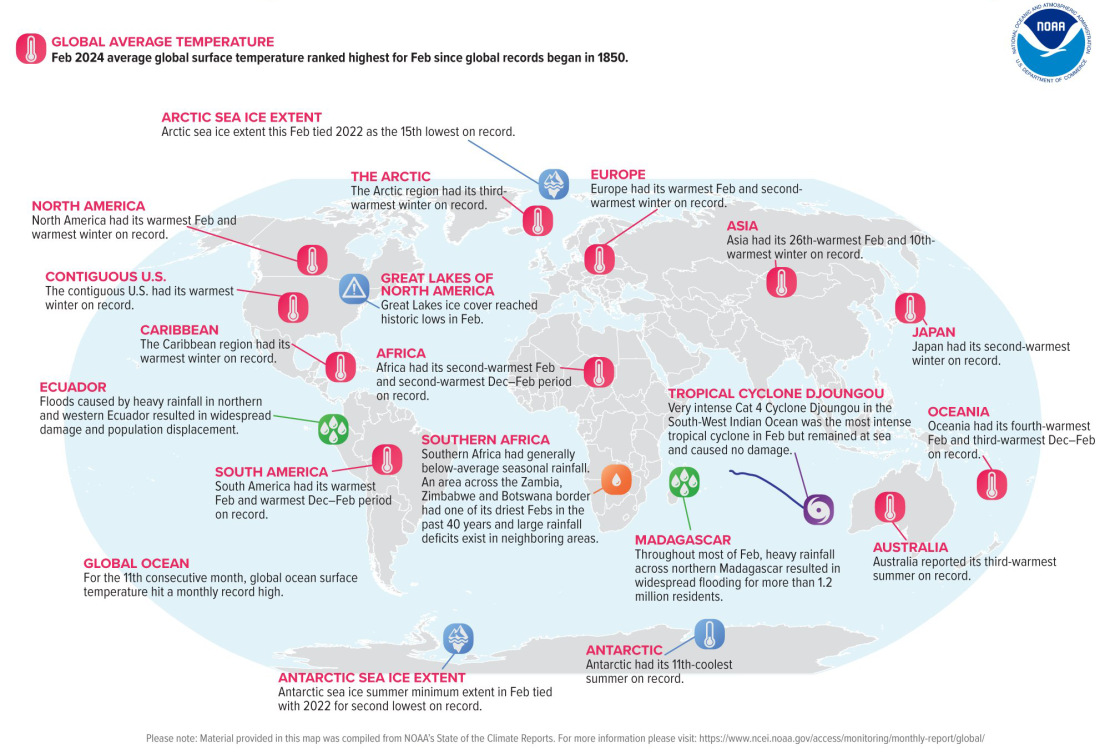
If last month being the planet’s hottest February — the ninth month in a row that a monthly record tumbled — failed to resonate, a new map from the National Oceanic and Atmospheric Administration shows all the ways the extreme warmth translated to impacts around the world.
The map shows the world’s most significant “climate anomalies,” or weather events that were unexpected for this time of year.
Country / Region Tags:
General Topic Tags:
Problem, Solution, SitRep, or ?:
Groups this Group Post belongs to:
- Private group -


Recent Comments